The Visibility Problem in Fiber Deployment
Fiber deployment is accelerating.
Programs now span multiple markets, jurisdictions, and regulatory environments at the same time.
But the way most operators track progress hasn’t changed.
Engineering moves forward in one system.
Permitting is tracked in another.
Construction lives somewhere else entirely.
On paper, everything is moving.
In reality, no one is seeing the full picture.
Where Visibility Breaks Down
Most deployment programs are not short on data.
They are short on clarity.
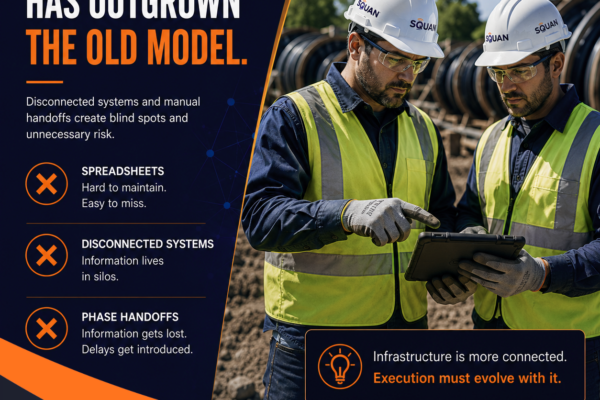
Spreadsheets update status.
Reports summarize progress.
Dashboards attempt to roll it all up.
But none of them answer the question that actually drives progress:
Is the network buildable right now?
Because deployment doesn’t move based on activity.
It moves based on readiness.
And readiness is geographic.
It lives in specific segments, tied to permits, designs, and field conditions. Not in rows of a spreadsheet.
Why This Problem Gets Worse at Scale
This gap is manageable in a single market.
It breaks down quickly across multiple builds.
As programs scale:
- Permitting timelines vary by jurisdiction
- Designs evolve as field conditions surface
- Construction sequences shift based on what is actually cleared
What looks like progress in a report often hides fragmentation underneath.
This is the same structural issue outlined in the BEAD Playbook:
Execution doesn’t fail because of capability.
It fails at the seams between phases.
When those seams aren’t visible, they can’t be managed.
And when they can’t be managed, they compound.
The Cost of Not Seeing It
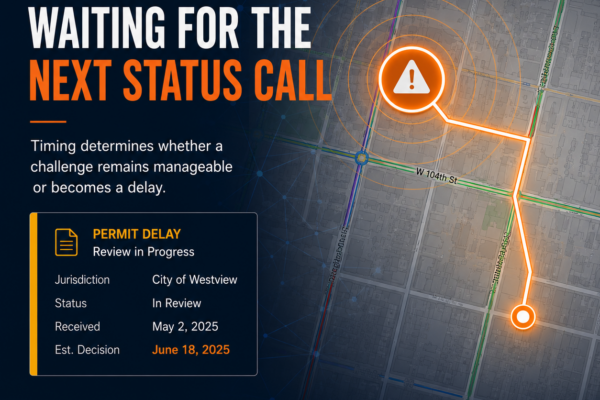
When visibility is fragmented, decisions lag reality.
Teams mobilize based on assumptions.
Permits are treated as milestones, not constraints.
Construction forecasts don’t reflect actual readiness.
The result isn’t just inefficiency.
It’s pressure.
Because as we’ve said before:
Waiting doesn’t reduce pressure.
It concentrates it.
And when issues surface late, they surface all at once:
- Crews stall
- Schedules compress
- Reporting becomes reactive
At that point, it’s not a visibility problem anymore.
It’s a credibility problem.
What Changes When You Can See the Build
The shift isn’t more reporting.
It’s operational visibility.
Seeing the network geographically changes how decisions get made.
Instead of asking:
- “What’s approved?”
- “What’s in design?”
Operators can see:
- What segments are actually buildable
- What permits are holding up progress
- Where construction can move now
That shift is what turns coordination into control.
As highlighted in the guide:
Visibility reflects real field conditions and supports both execution and trust.
From Fragmented Tracking to a Single View
This is exactly where most execution models start to shift.
Because solving for visibility is not about better reporting.
It’s about creating a system where engineering, permitting, and construction are no longer operating independently.
This is why SQUAN developed VECTOR.
VECTOR is not another reporting layer.
It is an operational environment that brings engineering, permitting, and construction into a single view.
From the demo:
- Permit boundaries are mapped and color-coded by status
- Engineering, permitting, and construction data live in one place
- Construction readiness is visible at the segment level
- Stakeholders can see what is approved, what is pending, and what is holding up progress
All of it tied to the network itself.
Not a spreadsheet.
Not a static report.
A live, geographic system.
Why the Map Matters
This is where most systems fall short.
They track status.
They don’t show impact.
VECTOR does both.
By managing deployment from a map:
- You see which permits are blocking specific passings
- You understand how delays affect real segments of the network
- You reduce windshield time and guesswork in the field
- You make faster, more accurate deployment decisions
Because the data isn’t abstract.
It’s anchored to the build.
The Bigger Shift Happening in Fiber Deployment
This isn’t just a tooling problem.
It’s an operating model shift.
As programs scale and scrutiny increases, the market is no longer evaluating progress based on activity.
It’s evaluating execution based on control.
That means:
- Visibility across phases, not within them
- Accountability tied to outcomes, not tasks
- Systems that reflect real conditions, not optimistic projections
Because in this environment:
Execution is not a series of updates.
It is a system.
And systems require visibility to function.
Experience VECTOR
Execution at scale demands clarity.
VECTOR provides real-time, map-based visibility across engineering, permitting, and construction, eliminating the blind spots that slow funded deployments and competitive expansions alike.
Interactive demo access will soon be available on SQUAN.com, giving operators a closer look at how map-based management improves sequencing, reduces friction, and accelerates turnover.
Because when visibility is built into the system, execution becomes predictable.
Go Deeper: The BEAD Playbook
Visibility is one piece of a larger execution challenge.
The operators who will succeed under BEAD are not just moving faster.
They are building systems that hold under pressure.
We break this down in more detail in: